Share price module
The Insage Share Price Volume module contains 3 sections, i.e:
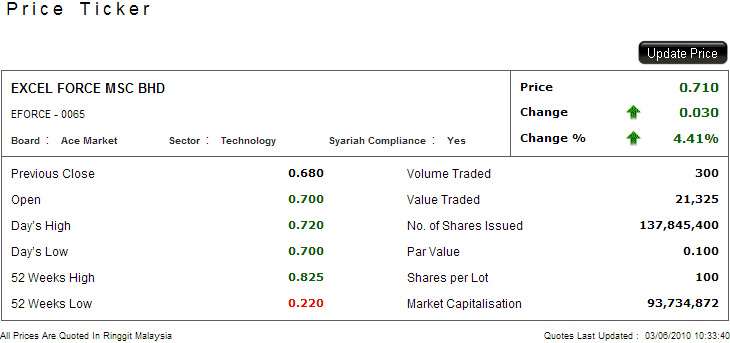
Real Time Price Ticker
The real‐time price feed shows the last done price and volume as and when the user clicks on the refresh icon or when the page is refreshed via F5. The time is shown to reflect the last done data.

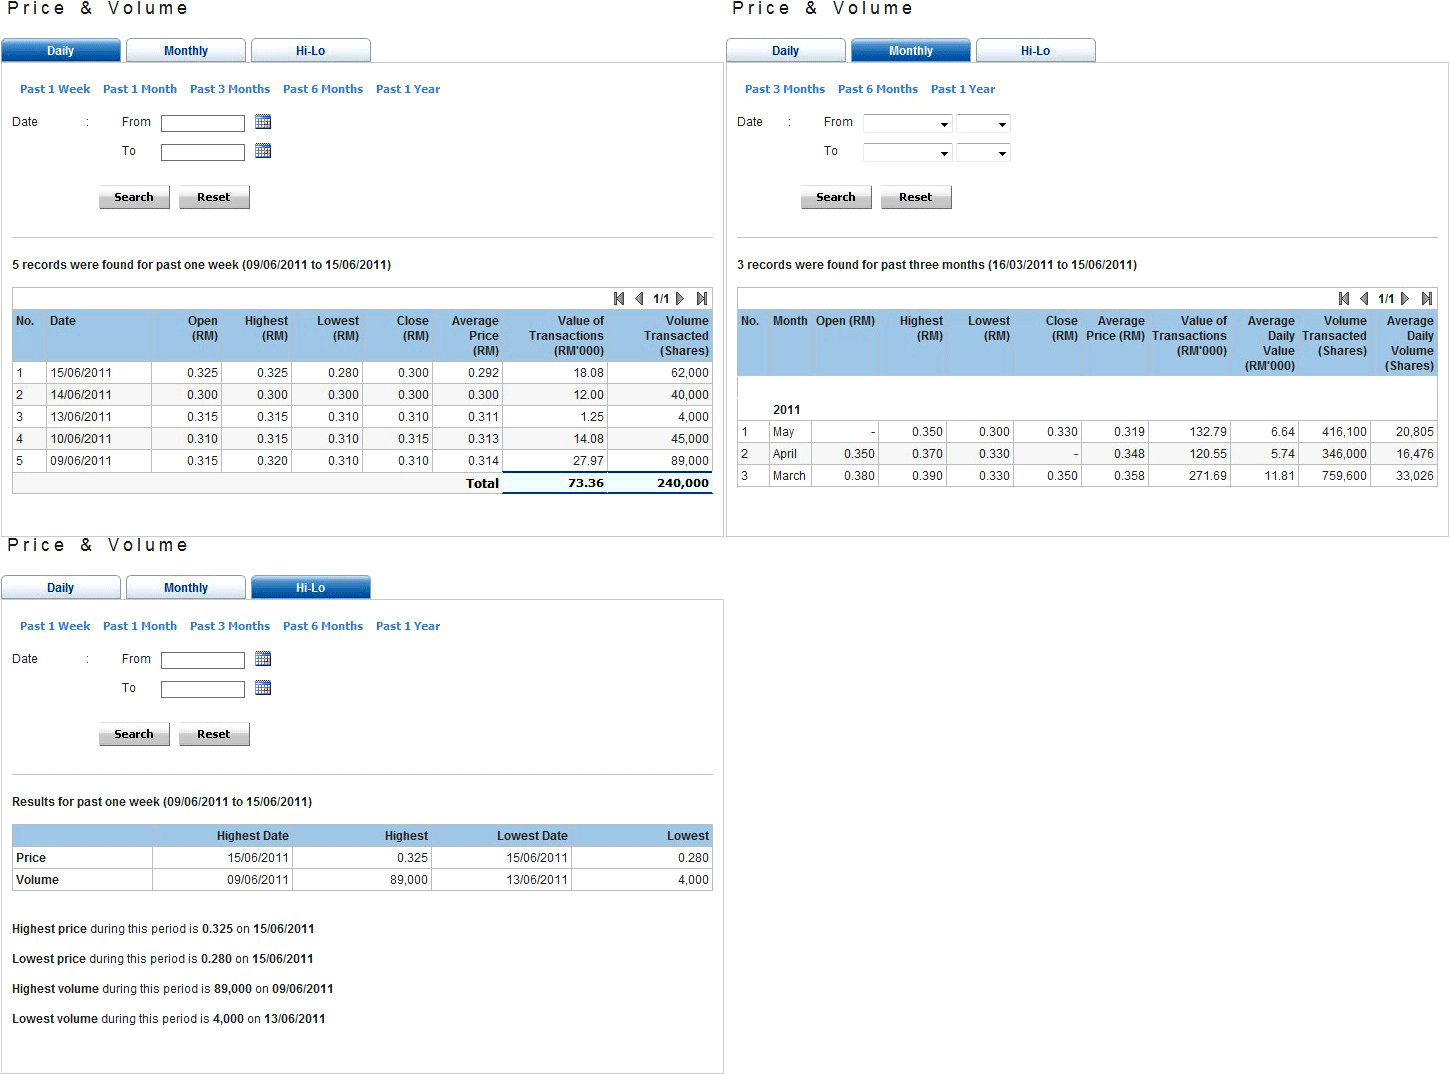
Share Price Volume Table
The share price volume table contains several functions to enable the user to have a quick sorting of the share price and volume history.
The data contains:- Open
- Highest
- Lowest
- Close
- Average Price
- Value of Transaction
- Volume of Transaction
| Share Price Volume Table | |
|---|---|
| Daily | Quick recall settings, i.e. Past 1 week, Past 1 Month, Past 3 Months, Past 6 Months and Past 1 Year, and also a calendar box for the user to select the date selections to view the daily price and volume data. |
| Monthly | Useful for users to have a quick view of the highest and lowest prices for the month. This section is useful for the public listed company ("PLC")'s annual report and circular whereby the share price table are disclosed. |
| Hi-Lo | Helps the user to sort out the highest and lowest price and volume data for a selected date range. |

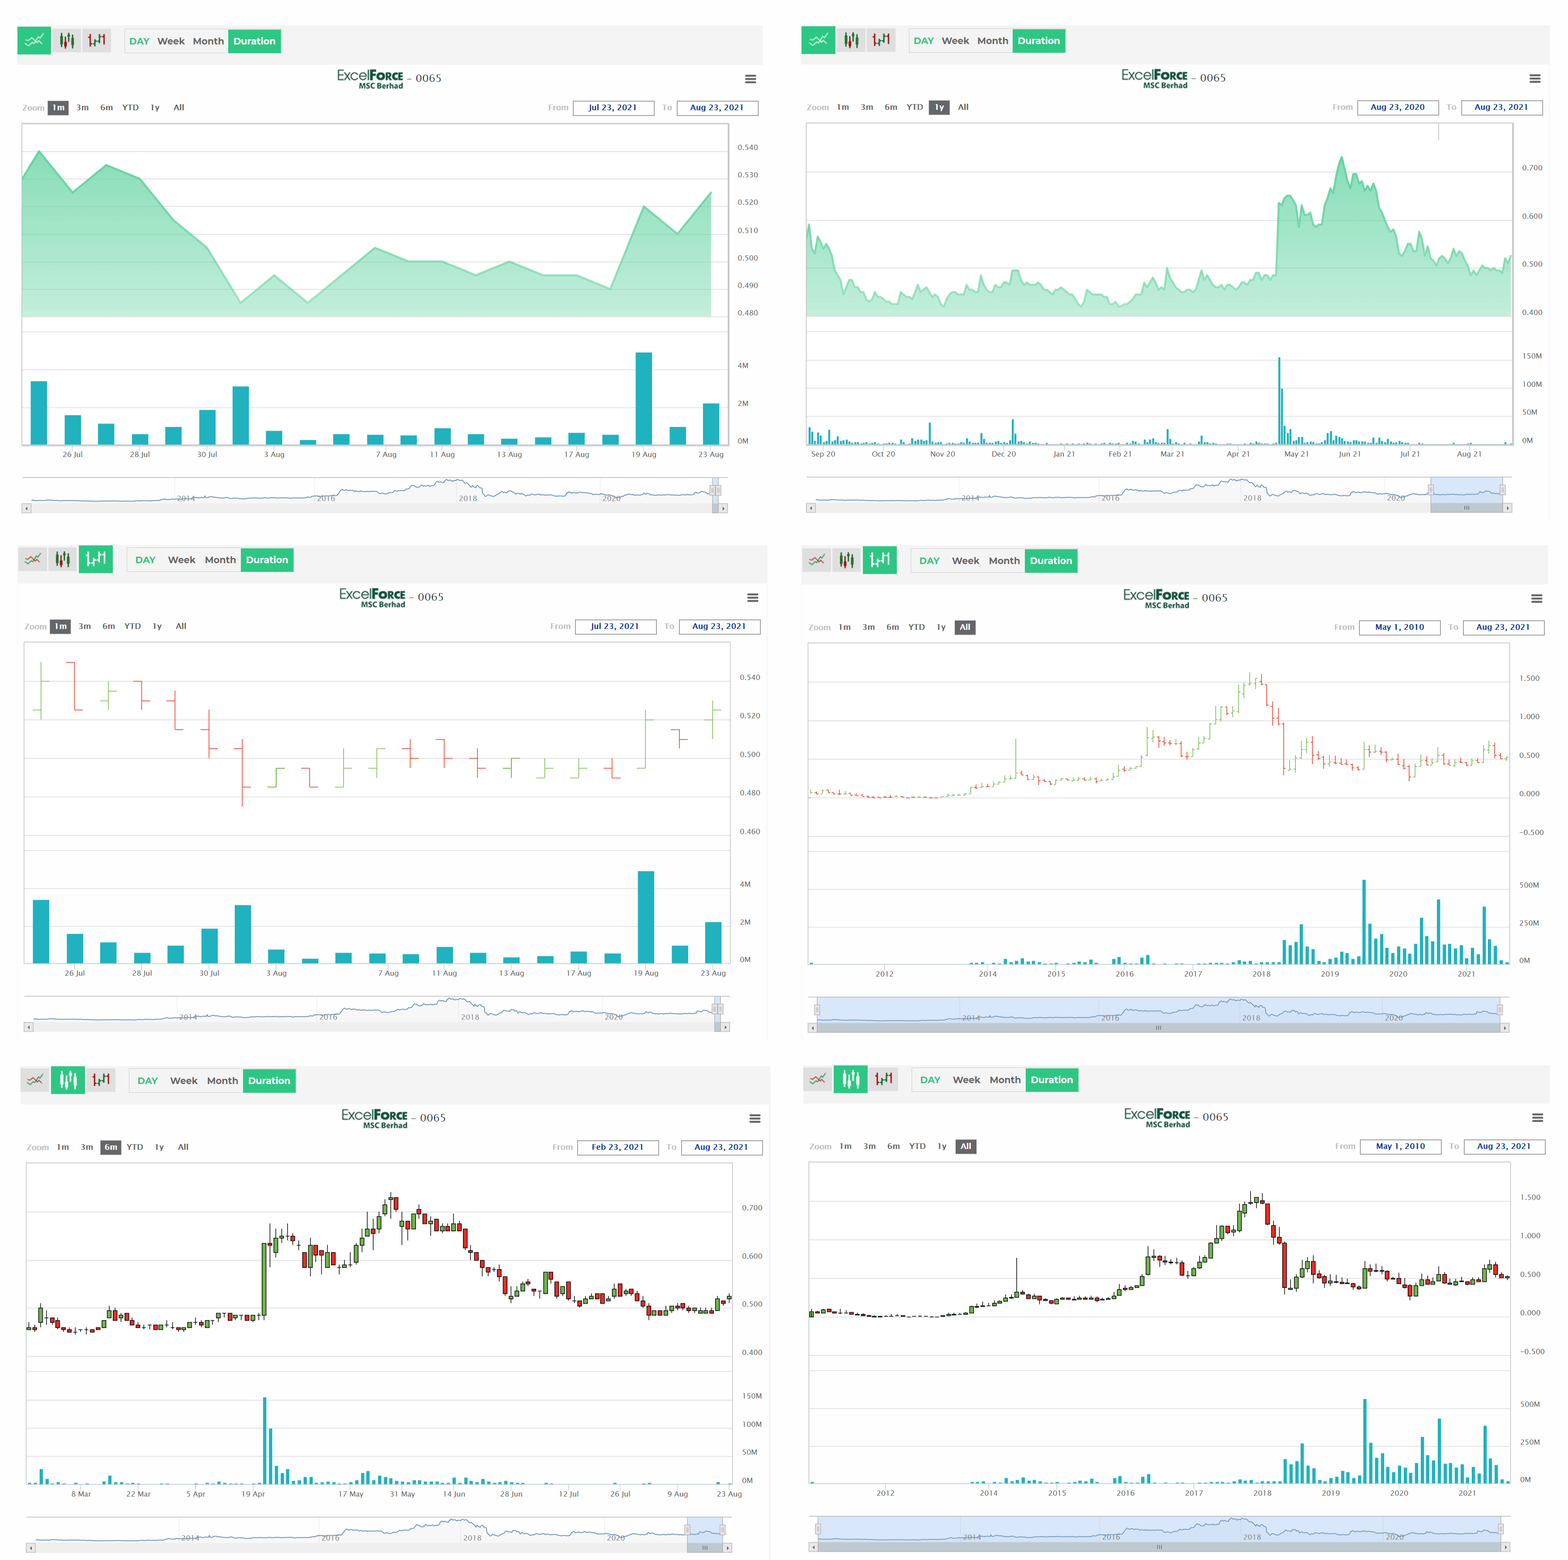
Interactive Stock Charts
Insage provides the end‐of‐day interactive stock charts for the PLC. The stock charts are presented in line chart, candlestick chart and Open-High-Low-Close (OHLC) chart. The charts can be viewed by day, week or month.
By default, the time periods available are as follows:
- 1 month
- 3 months
- 6 months
- Year to date
- 1 year
- All


