


 17 / 178

15
GHL Systems Berhad
(293040-D)
Annual report 2015
ceo
Report
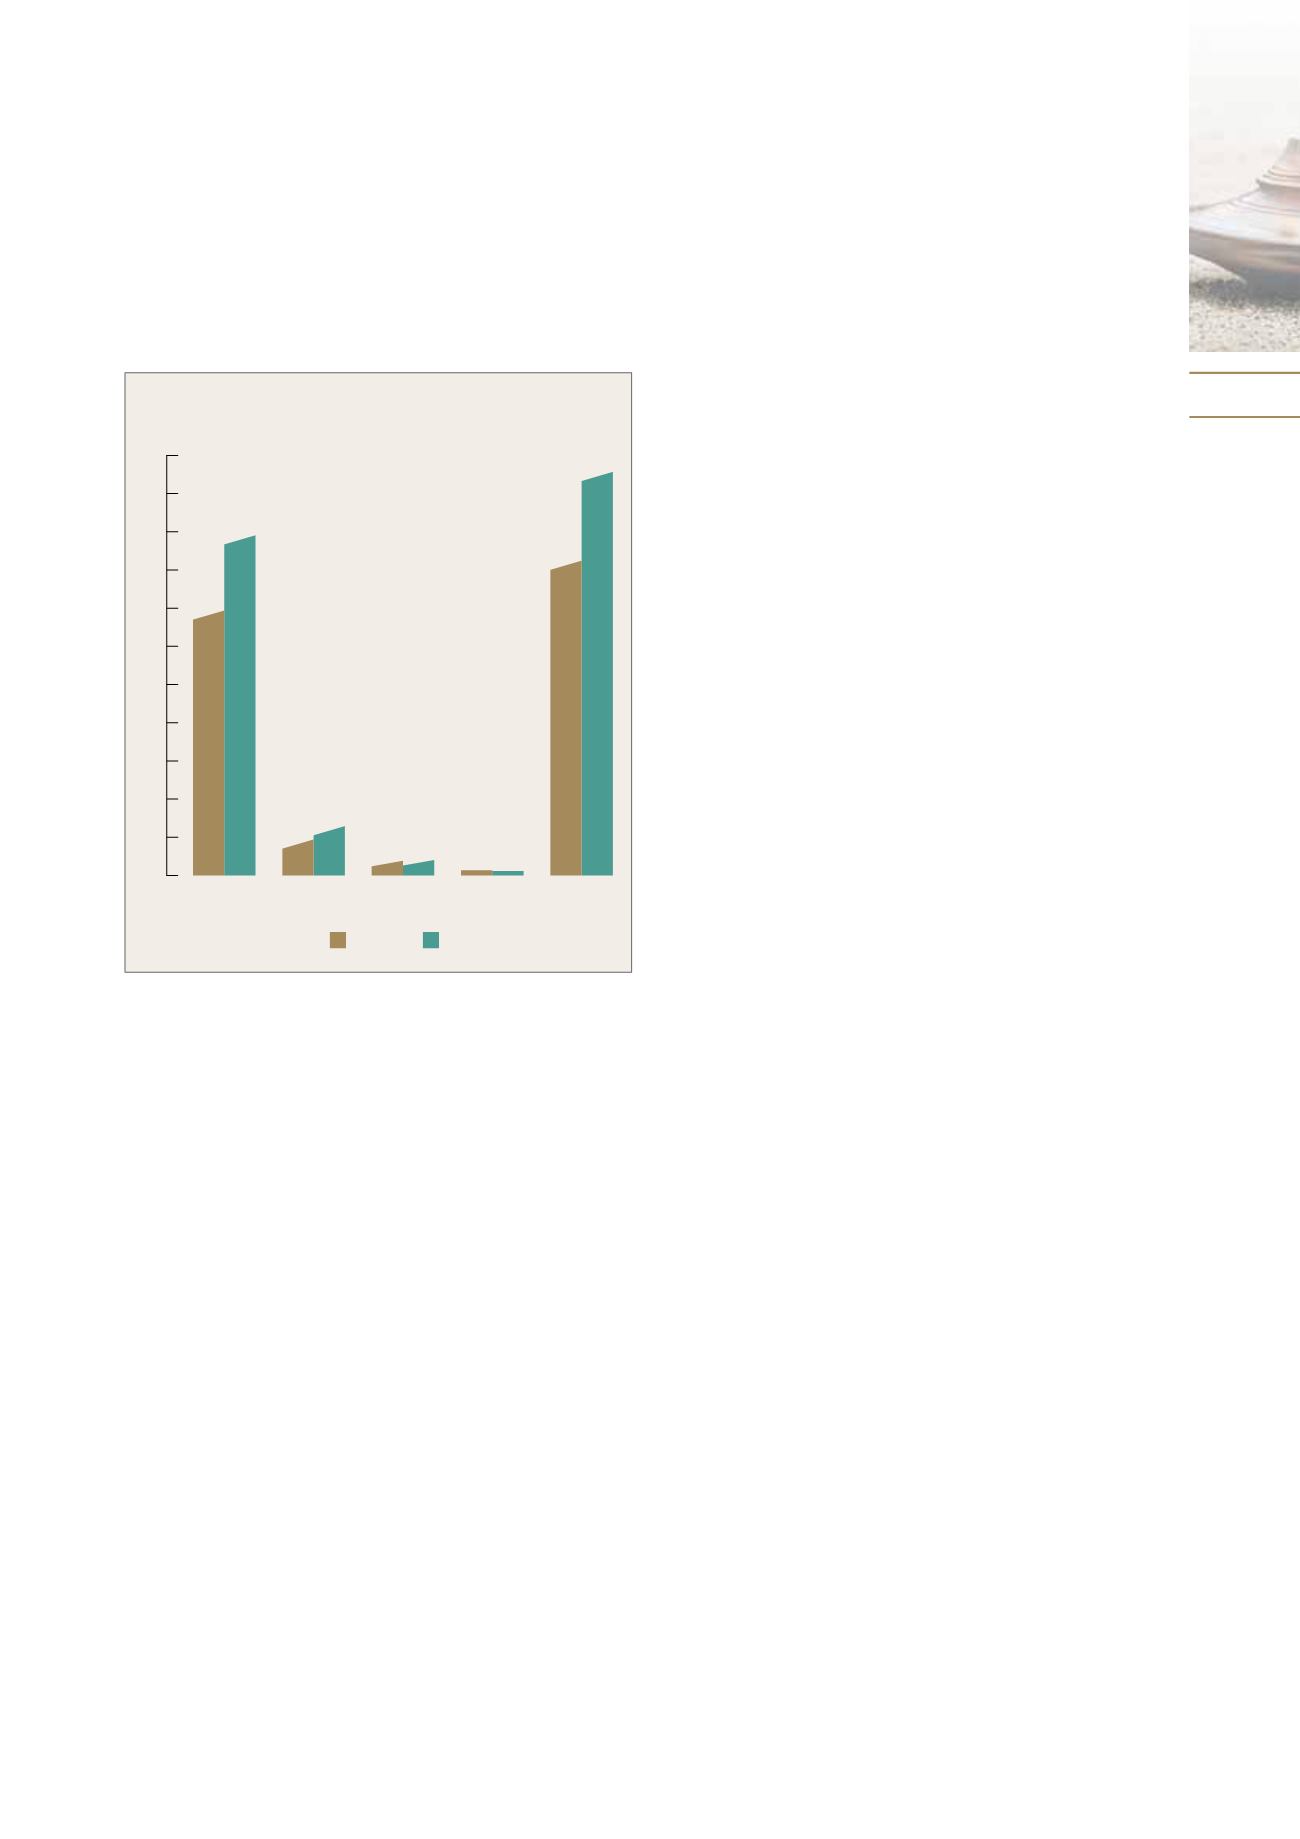
Figure 3 - Revenue by Country 2015 (RM’m)
Malaysia Philippines
Thailand
Australia
Total
2014
2015
0
20
40
60
80
100
120
140
160
180
200
220
138.8
178.2
164.9
211.4
18.9
25.9
5.8
6.2
1.4
1.1
2015 vs 2014 Revenue by Country (RMMillion)
2015 Group turnover grew +28% yoy to RM211.38
million (2014 – RM164.93 million). Pre-tax profits grew
+45% to RM16.12 million compared to RM11.12 million
a year ago with pre-tax margins better at 7.6%
compared to 2014’s pre-tax margins of 6.7%.
Malaysian operations contributed 84% of Group
turnover (2014 – 84%) and revenue grew 28% yoy
mainly due to higher EDC sales and rental revenues
and, growth of TPA transaction fee income and
volumes. EBIT margins were 9.4% for 2015, an
improvement from 7.8% in 2014.
Philippines turnover grew 37% yoy to RM25.92 million
(2014 - RM18.89 million) but EBIT margins were lower at
12.3% in 2015 vs 16.9% in 2014 due to lower hardware
sales (which had higher margins) as compared to the
annuity based rental, which continued to outperform.
Both Shared Services and TPA registered growth of
+24% and +32% respectively with Solutions Services
showing the highest growth at 6% but off a much
lower base in 2014. Philippines contributed 12.3% to
Group revenue in 2015.
Thailand recorded a small growth of 7% in revenue
due to an improvement in TPA revenues in 2015. This
was, tempered by a reduction in Shared Services and
Solutionsservicesrevenueof-6%and-39%respectively.
The business climate remains challenging in Thailand
due to the lacklustre economy and competitive
pressures from some of the Thai commercial banks.
The Group continues to be cautious in its investment
pending an improvement in the macro environment.
EBIT remained in negative territory with losses before
interest of RM2.18 million as compared to RM1.84
million losses in 2014. The loss increased slightly due to
the effect of weaker Ringgit when consolidating Thai
Bhat losses.
Australia remains the smallest contributor to Group
operations at RM1.05 million or 1% of group turnover
compared to 2014 turnover of RM1.39 million. This
led to a small EBIT contribution of RM0.21 million as
compared to the loss of RM0.11 million in the same
period for the previous year.
TRANSACTION PAYMENT ACQUISITION (“TPA”)
TPA revenue overall grew +32% in 2015 to RM157.25
million (2014 – RM119.64 million) driven primarily by
higher volume sales and terminal population growth.
The Bank TPA segment is relatively new and only
started growing in 3Q15 and 4Q15 after GHL signed
a TPA agreement with a major Malaysian banking
group in 2Q2015.
e-pay (Reload and Collection Services)
The e-pay, reload and bill collections business
constitutes the largest component within the TPA
segment (86% of 2015 TPA segment revenue). While
the reload and bill collections business constitutes
the most mature component within the overall TPA
segment, its gross revenue continues to grow strongly
- 20% to RM134.50 million in 2015 (2014 – RM118.30
million). To enable easier comparison, the values
shown in the 2014 column in Figure 4 are for the full
year rather than just the post-acquisition period of 10
months.