


 16 / 178

14
GHL Systems Berhad
(293040-D)
Annual report 2015
Group turnover for the 12 months in 2015 grew +28%
yoy to RM211.38 million (2014 – RM164.93 million)
driven by growth in all three segments; Shared Services
(+24% yoy), Solutions Services (+6% yoy) and TPA (32%
yoy). Pre-tax profits grew 45% to RM16.12 million as
compared to RM11.12 million a year ago and pre-tax
margins improved to 7.6% over 2014’s pre-tax margins
of 6.7%.
Net profit after tax grew by +61% yoy to RM10.24
million (2014 – RM6.37 million). Net profits grew at a
higher rate than pre-tax profits due to lower taxation
charges in 2015. The effective taxation charge in 2015
was 35% as compared to 43% in 2014 resulting from
deferred tax provisions in that financial year. Also, the
full year’s net profit result for 2015 would have been
much improved had the Group not incurred a charge
of RM1.21 million for unrealised forex losses arising from
an unexpected ringgit devaluation in 3Q2015. The
small US$ loan that caused this loss will be fully repaid
by the first half of 2016.
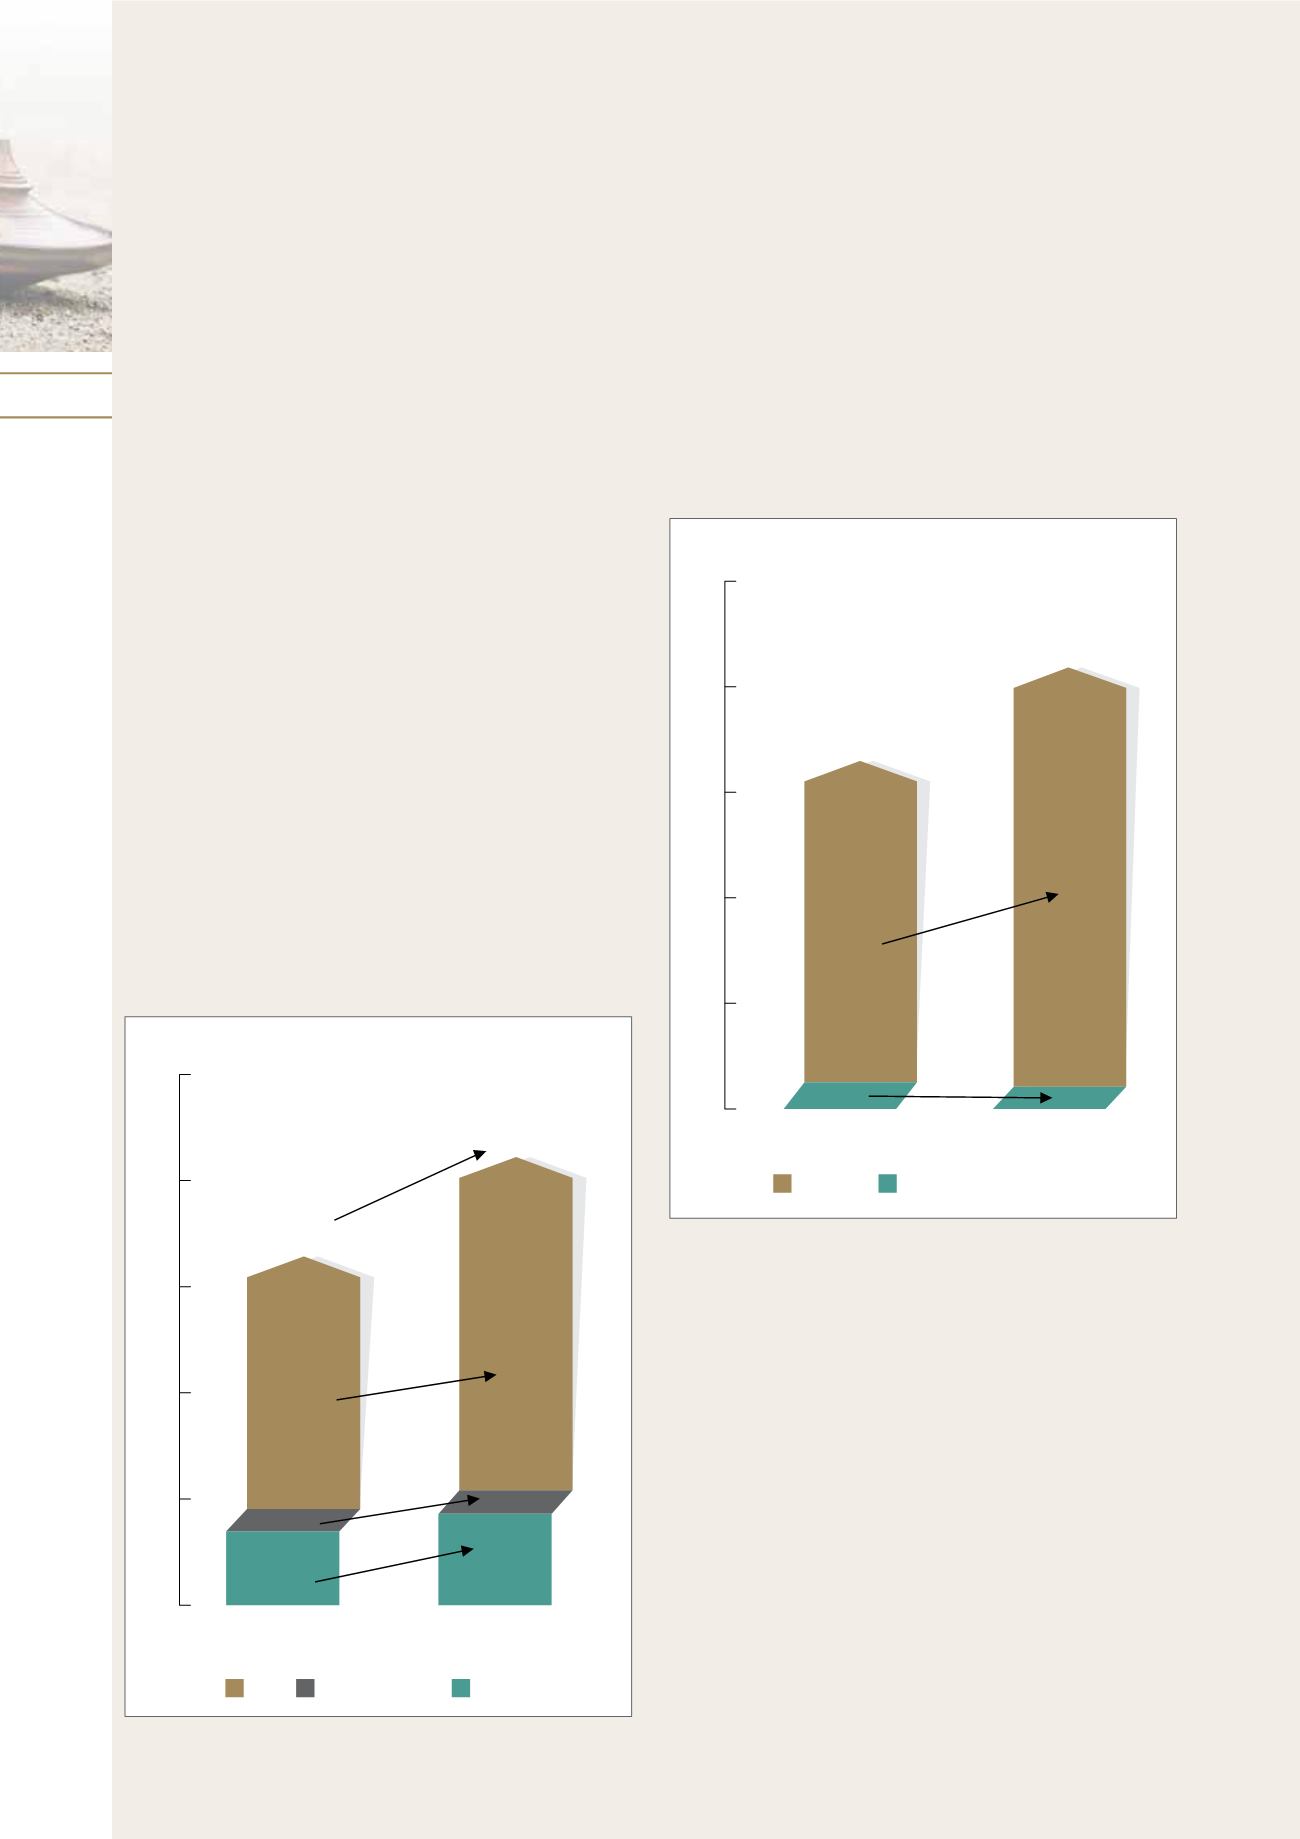
The chart in Figure 1 illustrates the significant changes
in business composition that occurred between 2014
and 2015.
Shared Services and TPA recorded strong growth
whereas Solutions Services revenue grew more
modestly due to fewer non-annuity software and
hardware sales in 2015 as compared to the same
period last financial year.
ceo
Report
Figure 1 - Revenue By Business Segment
0
50
100
150
200
250
28%
Total: RM211.4M
Total: RM164.9M
32%
6%
24%
YTD 2014 (RM’mil)
YTD 2015 (RM’mil)
RM119.6m
RM157.3m
RM11.1m
RM43.0m
RM10.5m
RM34.8m
TPA Solution Services
Shared Services
The annuity based component of the Group’s total
revenue grew from 92% of total revenue in 2014 to
94% of total revenue in 2015. The Group has now
clearly weaned itself of its previous dependency on
non-annuity based revenue streams. The non-annuity
component of the Group’s revenue has now shrunk
to 6% reflecting lower hardware and software sales
principally from Philippines operations in 2015. While
theGroup’s strategy remains focussedonaccelerating
the annuity based TPA businesses across the region,
the Group will continue to opportunistically contract
non-annuity based deals particularly if these support
the needs of our acquirers and our larger merchants.
On balance, it is likely that the mix between annuity
and non-annuity revenue will stabilise at these levels
in the near future.
Figure 2 - Annuity vs Non-Annuity Revenue
YTD 2014 (RM’mil)
YTD 2015 (RM’mil)
0
50
100
150
200
250
-21%
6%
8%
+1.7%
94%
92%
Total: RM211.4M
Total: RM164.9M
Annuity
Non-annuity
(Note: The 2014 TPA Revenue component only includes 10
months of e-pay’s post acquisition revenue)
(Note: The 2014 Annuity Revenue component only includes
10 months of e-pay’s post acquisition revenue)