Annual report 2014
15
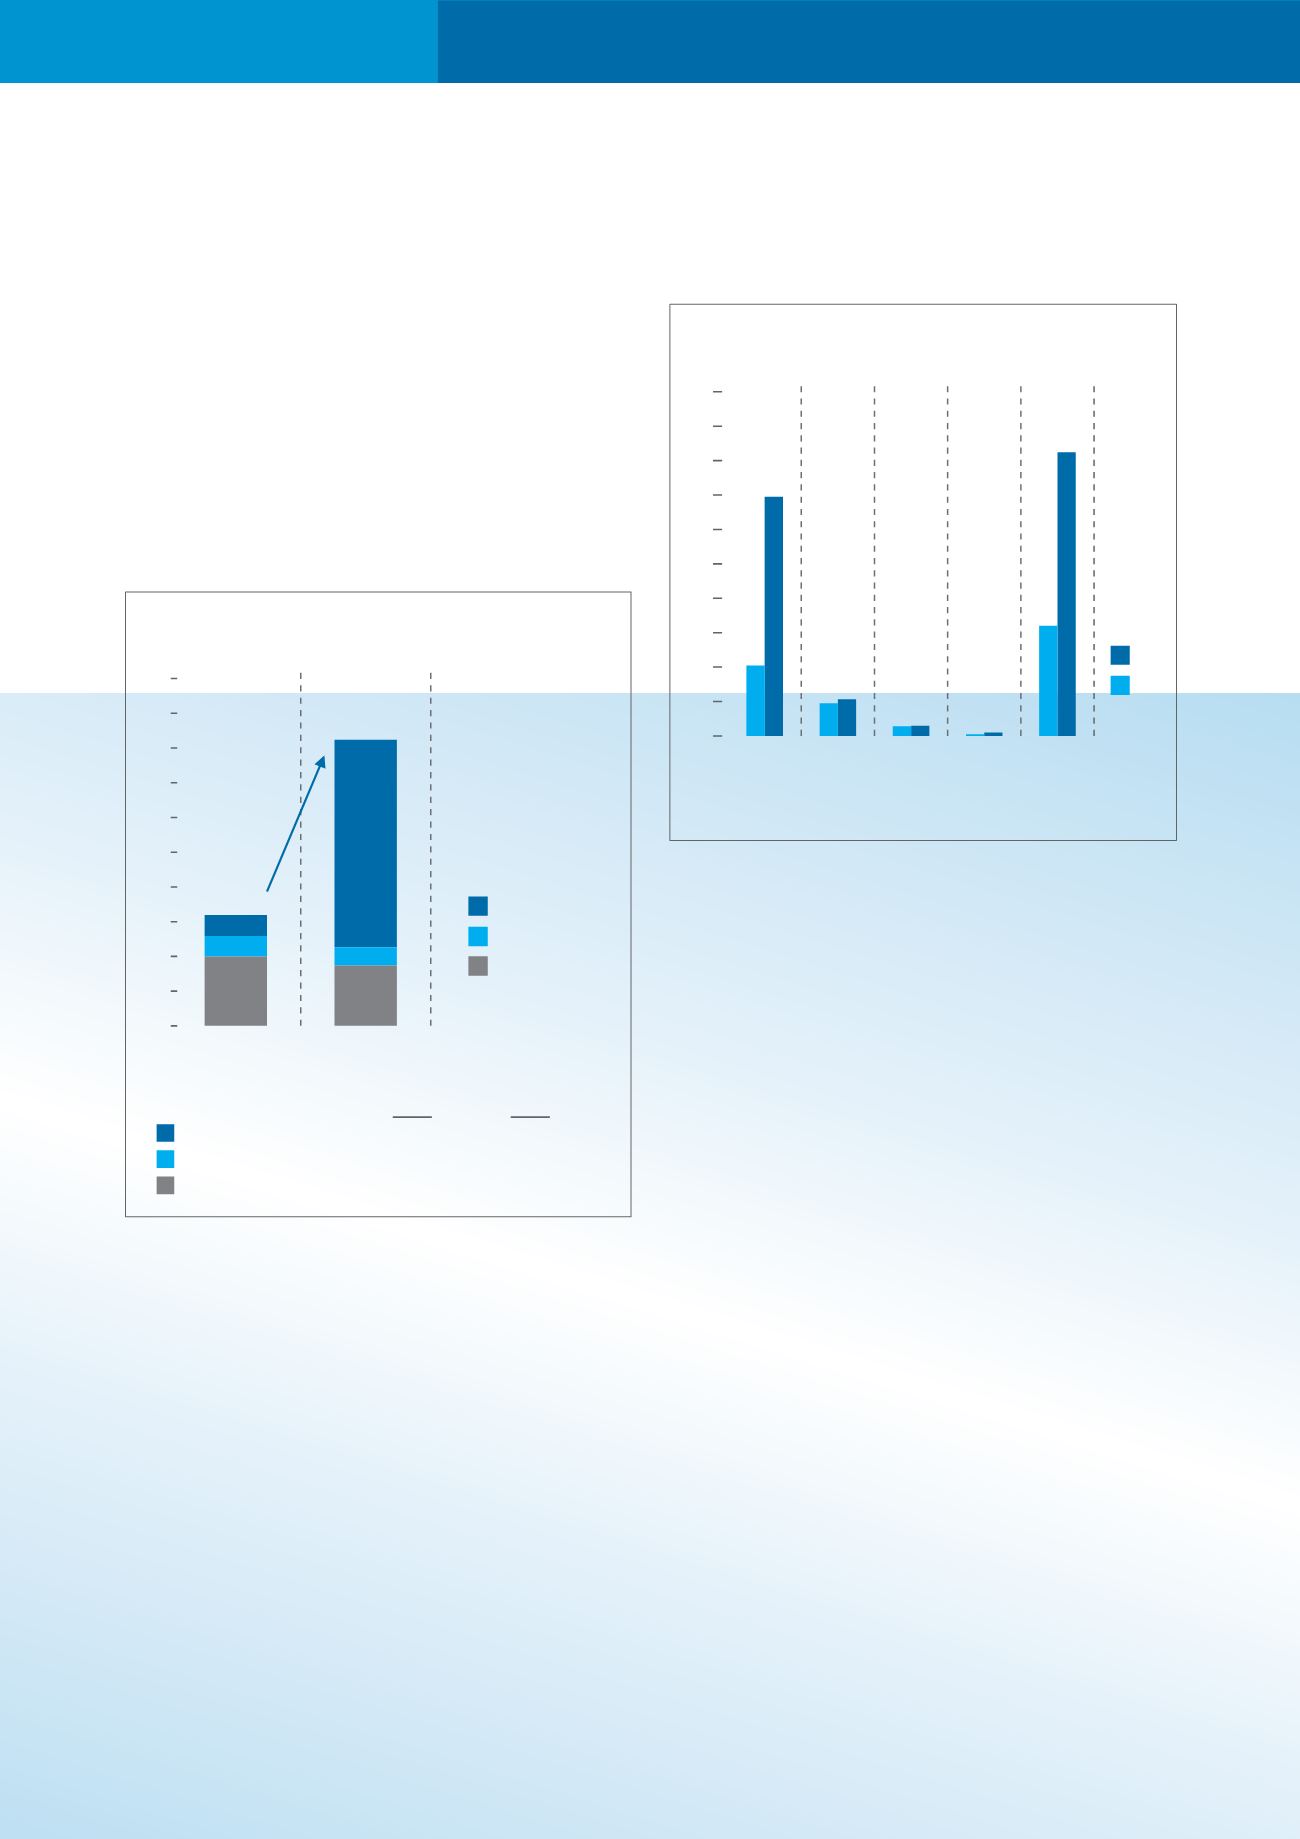
Figure 4 - Revenue by Country
0
20
40
60
80
100
120
140
160
180
200
2014
2013
Malaysia
Philippines
Thailand
Australia
Total
(RM’Mil)
FINANCIAL AND OPERATIONAL HIGHLIGHTS
In 2014, the TPA division replaced Shared Services as
the largest contributor to group turnover as e-pay’s
contribution was included for the last 10 months of the
financial period under review. Shared Services and
Solution Services were both marginally lower year-on-
year as maintenance fees, hardware and card sales
in 2014 were lower compared to the same period last
year.
Transaction Payment Acquisition (“TPA”)
The primary focus of the Group in 2015 will be to
implement the TPA business across the group. The
TPA initiative marks the latest phase of our evolution
and is strategic to the group. This TPA business has 2
distinct components, each in a different stage of
development. These are; i) e-pay’s direct contractual
relationships with merchants to provide Telco prepaid
and other top-up facilities and, bill collection services
for consumers (“reloadand collection services”) and ii)
GHL’s direct contractual relationships with merchants
to provide international and domestic card payment
services (“card payment services”). Each of these is
described in more detail as follows:-
e-pay (reload and collection services)
e-pay is the largest provider of reload and collection
services in Malaysia. It has about 23,000 acceptance
points nationwide, encompassing all petrol chains,
the largest convenience store chains and over 8,000
general stores. The e-pay brand is well known to
consumers who use the service. With over 15 years
experience, e-pay is clearly the market leader in
Malaysia within this industry segment.
Figure 3 - Revenue By Business Segment
0
20
40
60
80
100
120
140
160
180
200
TPA
Solution Services
Shared Services
2013
(RM mil)
64.0
158%
164.9
2014
(RM mil)
Malaysian operations contributed the most to group
revenue primarily due to the inclusion of e-pay’s
revenues. At the EBIT margins level, Malaysian
operations (excluding inter-segment sales) improved
25.0% in 2014 versus 4.2% in 2013.
Philippines turnover grew 12.4% year-on-year to
RM19.0m (2013-16.8m) and EBIT margins maintained
at 16.9% in 2014 (2013-16.8%).
Thailand recorded modest revenue growth of 2.9% to
RM5.8 million (2013 RM5.7m) despite the challenging
market conditions caused by its uncertain political
climate. EBIT was negative with losses of RM1.9 million
compared to RM1.0 million loss in 2013 principally due
to provision and restructuring reserves taken.
ceo
report
2013
2014
Shared Services
39.9
34.8
Solutions Services
11.8
10.5
TPA
12.3
119.6


