14
GHL Systems Berhad
(293040-D)
The transformation of the company from ad-hoc
hardware and software sales to the present of
providing services on a rental and revenue share
model has positively impacted the nature of our
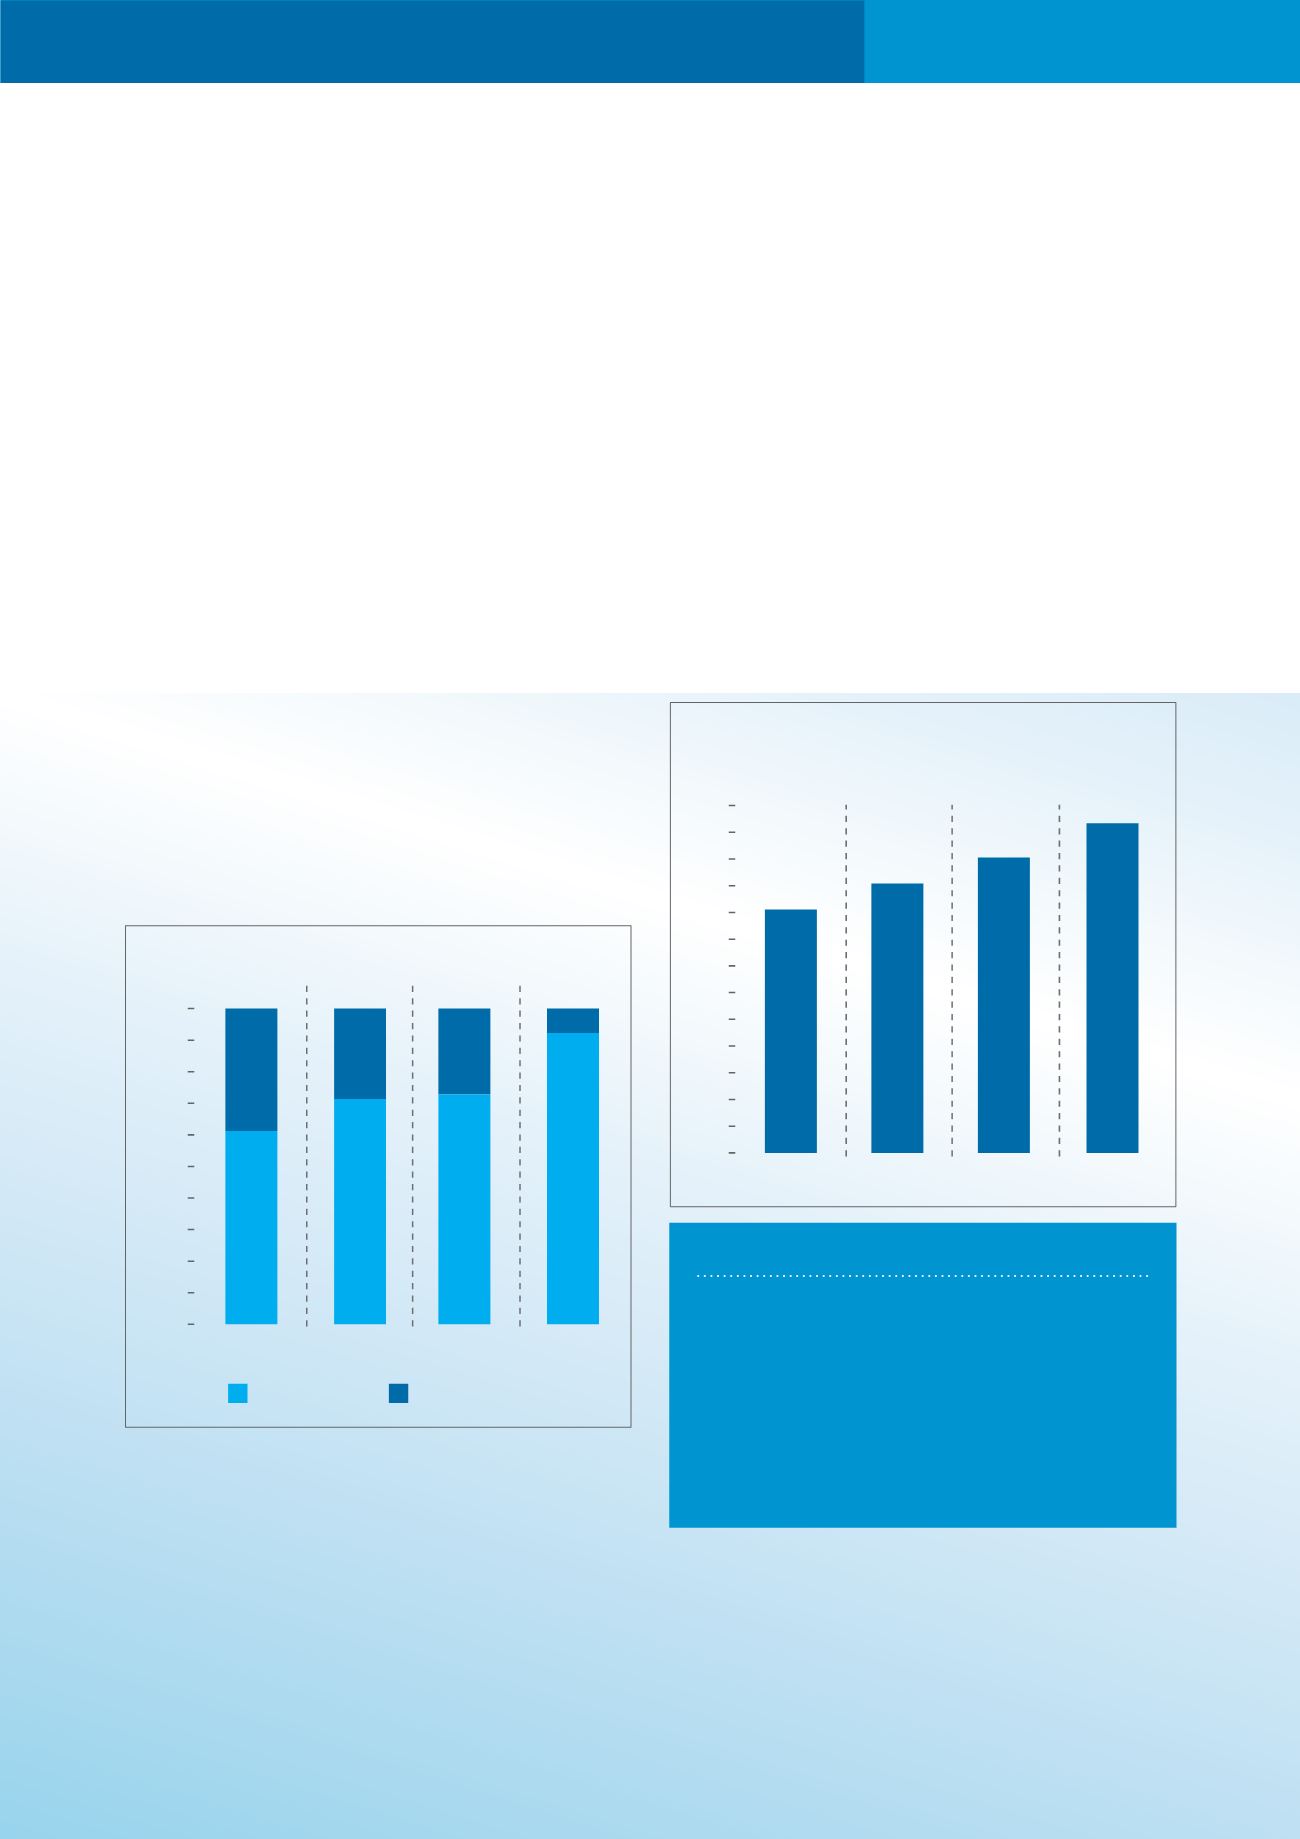
revenues. As can be seen in Figure 1, the percentage
of our recurrent revenue has increased significantly
from 61.2% in 2011 to 92.3% in 2014. This in turn, has
improved the predictability and quality of our earnings
and hence, the value of your company.
In 2014, our annuity income increased significantly
over the previous year primarily because of the
inclusion of e-pay Asia Limited (“e-pay”), a company
that was acquired by GHL in the year. e-pay ‘s revenue
is derived from merchants under agreements directly
entered into between e-pay and the merchants.
The e-pay acquisition effectively jumped-started our
Transaction Payment Acquisition (“TPA”) business
and this is congruent with our ambition to become
ASEAN’s largest merchant acquirer. A more detailed
description of e-pay and its contribution to our TPA
business can be seen in the TPA section that follows
later.
2014, there were approximately 230,000 terminals
in Malaysia (Source: Bank Negara) and 150,000 in
the Philippines (Source: Our own estimate). Also, we
estimate that there are at least 500,000 companies in
the smallest merchant segment each in Malaysia and
Philippines that are not POS enabled. Further, Bank
Negara in its recent payment reform regulations, has
mandated Banks in Malaysia to increase the number
of POS acceptance points from 230,000 in 2014 to
>800,000 in 2020. GHL’s TPA initiative (described
more fully in a later section) assists Banks to achieve
this target. For these reasons, there is a significant
opportunity for growth in merchant acquisition within
the total addressable market.
Figure 1 - Annuity Vs Non-Annuity Revenue
0
10
20
30
40
50
60
70
80
90
100
110
38.8
28.6
27.2
7.7
61.2
71.4
72.8
92.3
2011
2012
2013
2014
Annuity (%)
Non-annuity (%)
Figure 2 - Number of Acceptance Points
(Thousands)
0
10
20
30
40
50
60
70
80
90
100
110
120
130
2011
2012
2013
2014
2014 snapshot
DISTRIBUTION BY COUNTRY: 2014
Malaysia*– 63.7K
Philippines – 52.9K
Thailand – 6.8K
* inclusive of e-pay’s acceptance points for the
period 2011-2014
ceo
report
The creation of nationwide sales organisations in
2012, to actively source for merchants to accept card
payments has also enabled us to increase our POS
acceptance points and market share in the countries
that we operate in. This initiative has made us the
largest payment service provider both in Malaysia
and the Philippines. The growth in the number of
our acceptance points can be seen in Figure 2. In


