


 7 / 136

6
FRONTKEN CORPORATION BERHAD
(651020-T)
ANNUAL REPORT
2015
SEGMENTAL REVENUE – BY CUSTOMER LOCATION (RM’000)
2011
2012
2013
2014
2015
Singapore
66,295 64,053 59,481 42,740
35,263
Malaysia
61,447 45,835 43,600 157,893
113,398
Taiwan
51,430 49,689 63,992 90,405
107,337
Others
18,951 21,458 23,538 18,807
24,575
198,123
181,035
190,611
309,845
280,573
SEGMENTAL REVENUE – BY INDUSTRY (RM’000)
2011
2012
2013
2014
2015
Oil & Gas
26,965 21,963 18,153 131,062
91,856
Power Generation
22,810 22,174 17,365 12,416
7,457
Semiconductor
99,853 90,636 107,344 139,600
158,737
General*
48,495 46,262 47,749 26,767
22,523
198,123
181,035
190,611
309,845
280,573
* Comprises aerospace, marine, steel, cement, wood processing, pulp & paper, printing, agriculture, industrial manufacturing, food,
construction and other sectors.
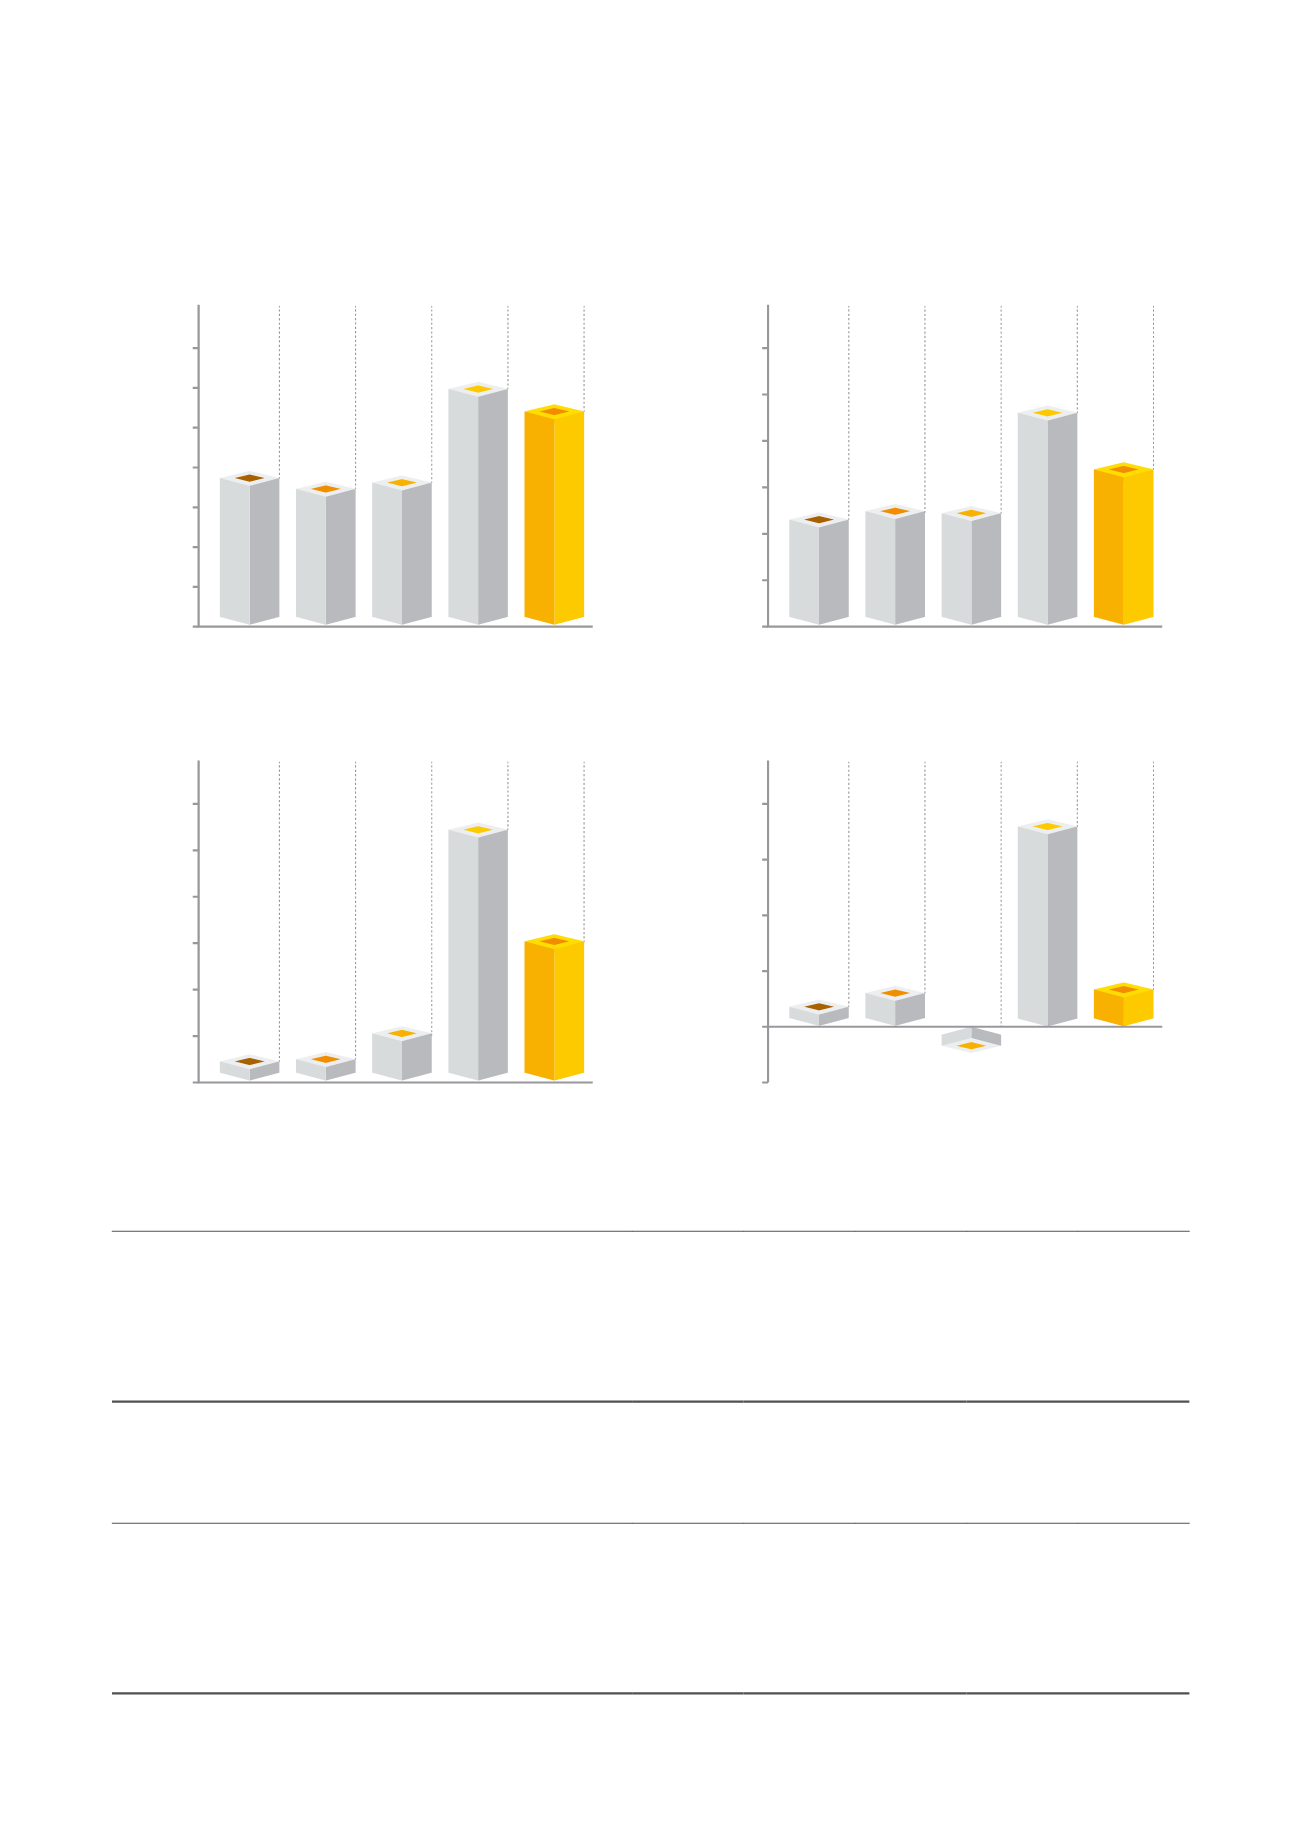
FINANCIAL
HIGHLIGHTS
Revenue (RM’000)
300,000
200,000
100,000
350,000
250,000
150,000
50,000
0
2011
198,123
181,035
309,845
190,611
280,573
2012 2013 2014
2015
2011 2012 2013 2014
2015
2011 2012 2013 2014
2015
2011 2012 2013 2014
2015
Earning Before Interest, Tax, Depreciation and Amortisation
(RM’000)
40,000
20,000
60,000
50,000
30,000
10,000
0
24,819
26,276
47,790
26,106
35,625
Profit Before Tax (RM’000)
20,000
10,000
30,000
25,000
15,000
5,000
0
2,999
3,238
28,140
5,911
15,998
Net Profit (RM’000)
15,000
5,000
20,000
10,000
0
(5,000)
2,484
3,820
18,775
(2,321)
4,007