FRONTKEN CORPORATION BERHAD
(651020-T)
ANNUAL REPORT 2014
07
FINANCIAL
HIGHLIGHTS
(cont’d)
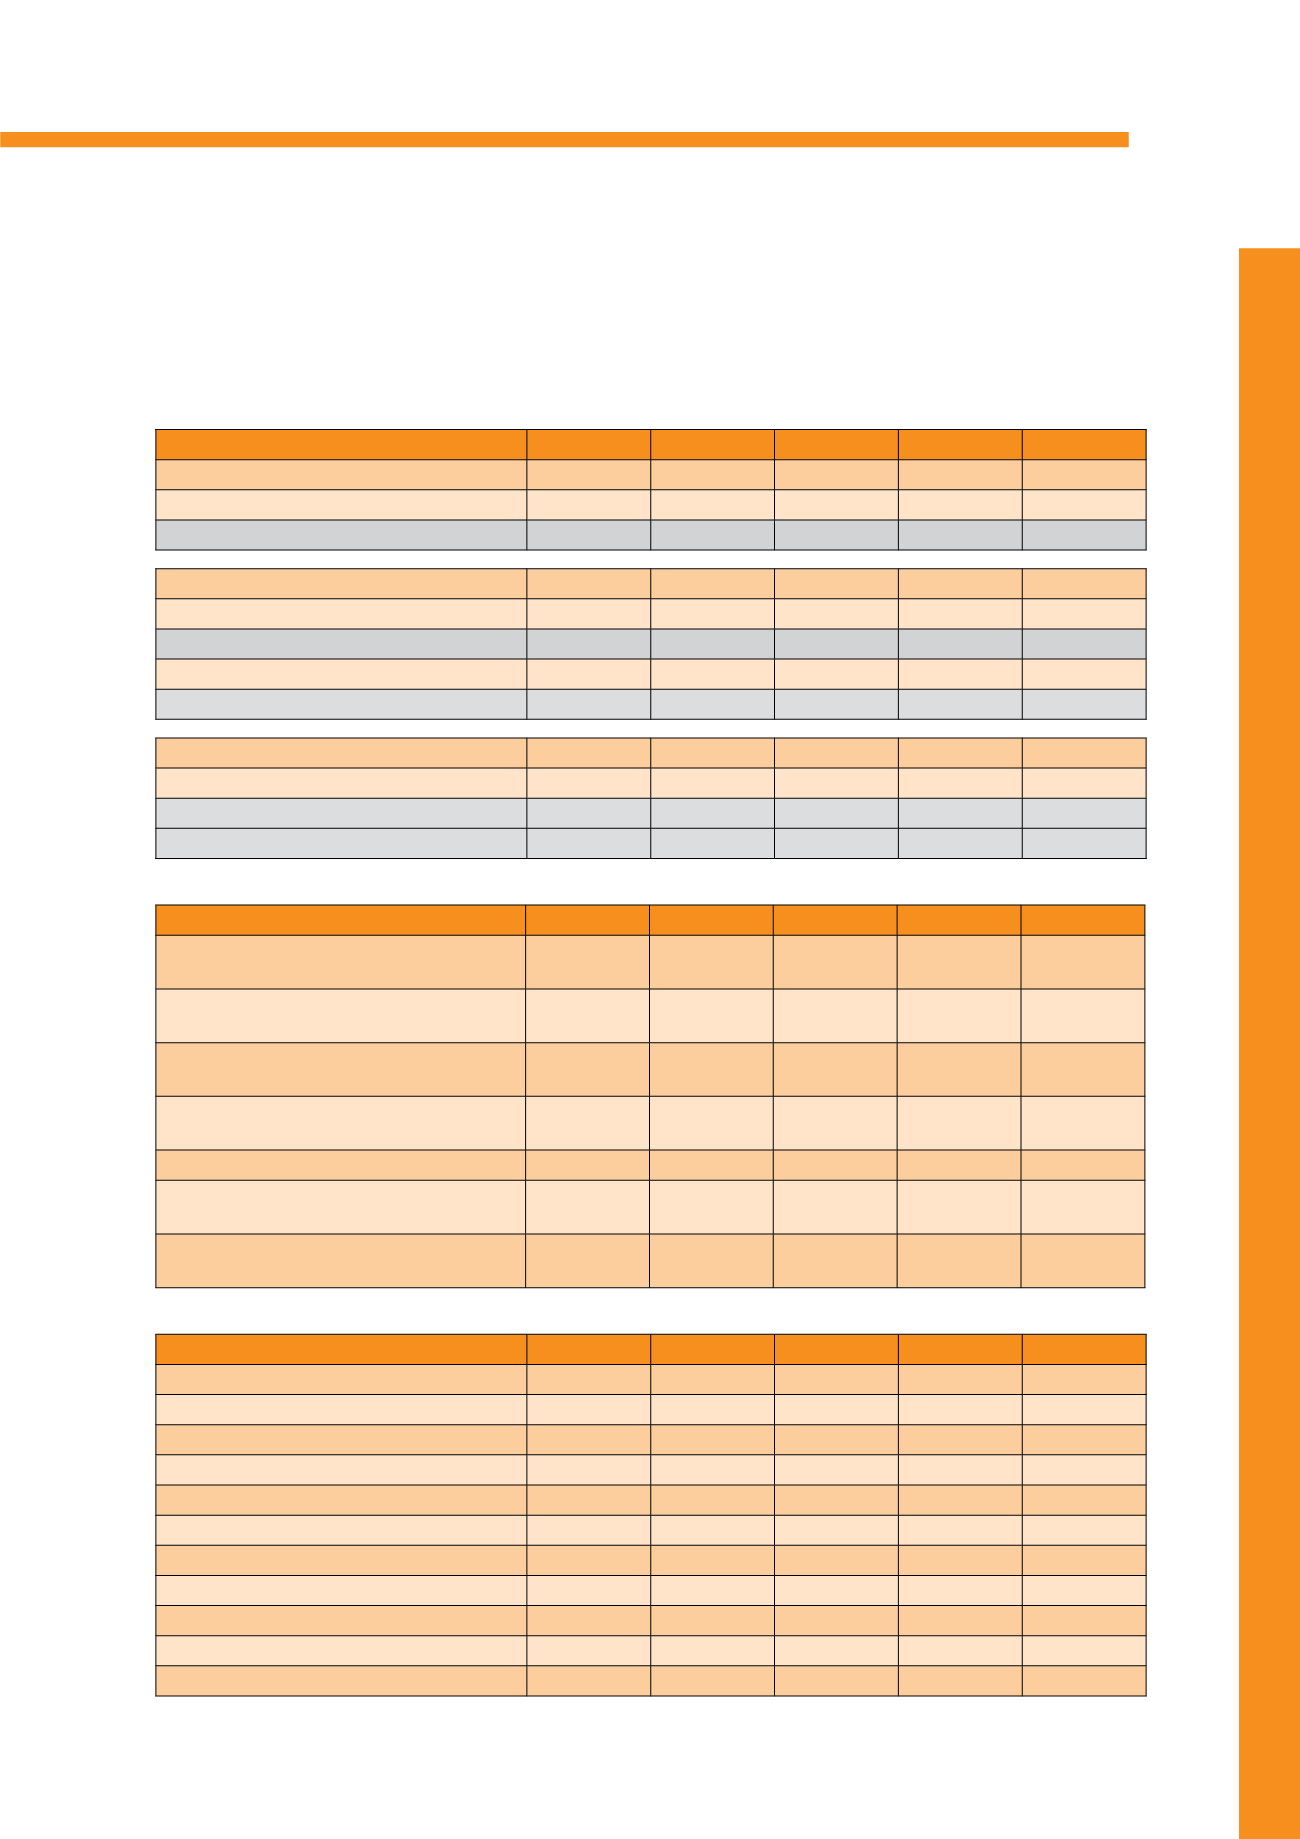
SUMMARISED GROUP BALANCE SHEETS
AS AT 31 DEC (RM’000)
2010
2011
2012
2013
2014
Non-Current Assets
211,563 214,177 183,606 171,779 173,019
Current Assets
121,628 119,411 131,016 130,379 183,363
Total Assets
333,191 333,588 314,622 302,158 356,382
Share Capital
101,141 101,141 101,141 101,141 101,141
Reserves
75,102
78,131
83,752
85,162 105,663
Shareholders’ Equity
176,243 179,272 184,893 186,303 206,804
Non-Controlling Interests
25,902
27,890
28,116
27,924
32,913
Total Equity
202,145 207,162 213,009 214,227 239,717
Non-Current Liabilities
62,572
55,614
32,095
29,484
27,958
Current Liabilities
68,474
70,812
69,518
58,447
88,707
Total Liabilities
131,046 126,426 101,613
87,931 116,665
Total Equity and Liabilities
333,191 333,588 314,622 302,158 356,382
SUMMARISED GROUP CASH FLOWS
YEAR ENDED 31 DEC (RM’000)
2010
2011
2012
2013
2014
Net Cash Flows From Operating
Activities
20,919
24,587
16,043
36,681
40,672
Net Cash Flows (For)/From Investing
Activities
(35,390)
(6,403)
17,527
(8,010)
(21,164)
Net Cash Flows From/(For) Financing
Activities
25,217 (14,771)
(16,946)
(34,105)
(4,426)
Net Increase/(Decrease) in Cash and
Cash Equivalents
10,746
(3,413)
16,624
(5,434)
15,082
Effect of exchange differences
134
257
208
1,061
1,079
Cash and Cash Equivalents at
Beginning of Year
9,405
20,285
23,955
40,787
36,414
Cash and Cash Equivalents at End of
Year
20,285
23,955
40,787
36,414
52,575
FINANCIAL ANALYSIS
(RM’000)
2010
2011
2012
2013
2014
Turnover growth
6.8% 35.0% -8.6% 5.3% 62.6%
Profit Before Tax Growth
61.7% -77.1% 8.0% 82.5% 376.1%
Net Profit Growth
42.6% -79.3% 53.8% -160.8% 909.0%
Pre-tax Profit Margin
8.9% 1.5% 1.8% 3.1% 9.1%
Net Profit Margin
8.2% 1.3% 2.1% -1.2% 6.1%
Gearing Ratio (Net of cash) (times)
0.3
0.3
0.1
0.0
0.0
Return on Average Shareholders’ Equity
7.7% 1.4% 2.1% -1.3% 9.6%
Return on Average Total Assets
4.2% 0.7% 1.2% -0.8% 5.7%
Loss/Earnings Per Share (Sen)
- Basic
^1.3
0.3
0.4
-0.2
1.9
- Diluted
1.0
n/a
n/a
n/a
n/a
^ Computed based on weighted average number of shares which had been adjusted to incorporate the effect of the rights issue
implemented in 2010


