FRONTKEN CORPORATION BERHAD
(651020-T)
ANNUAL REPORT 2014
06
FINANCIAL
HIGHLIGHTS
SEGMENTAL REVENUE – BY CUSTOMER LOCATION (RM’000)
2010
2011
2012
2013
2014
Singapore
66,501
66,295
64,053
59,481
42,740
Malaysia
68,966
61,447
45,835
43,600 157,893
Taiwan
-
51,430
49,689
63,992
90,405
Others
11,237
18,951
21,458
23,538
18,807
146,704 198,123 181,035 190,611 309,845
SEGMENTAL REVENUE – BY INDUSTRY (RM’000)
2010
2011
2012
2013
2014
Oil & Gas
39,336
26,965
21,963
18,153 131,062
Power Generation
33,528
22,810
22,174
17,365
12,416
Semiconductor
41,177
99,853
90,636 107,344 139,600
General *
32,663
48,495
46,262
47,749
26,767
146,704 198,123 181,035 190,611 309,845
* Comprises aerospace, marine, steel, cement, wood processing, pulp & paper, printing, agriculture, industrial manufacturing,
food, construction and other sectors
2010
0
50,000
100,000
150,000
250,000
200,000
300,000
350,000
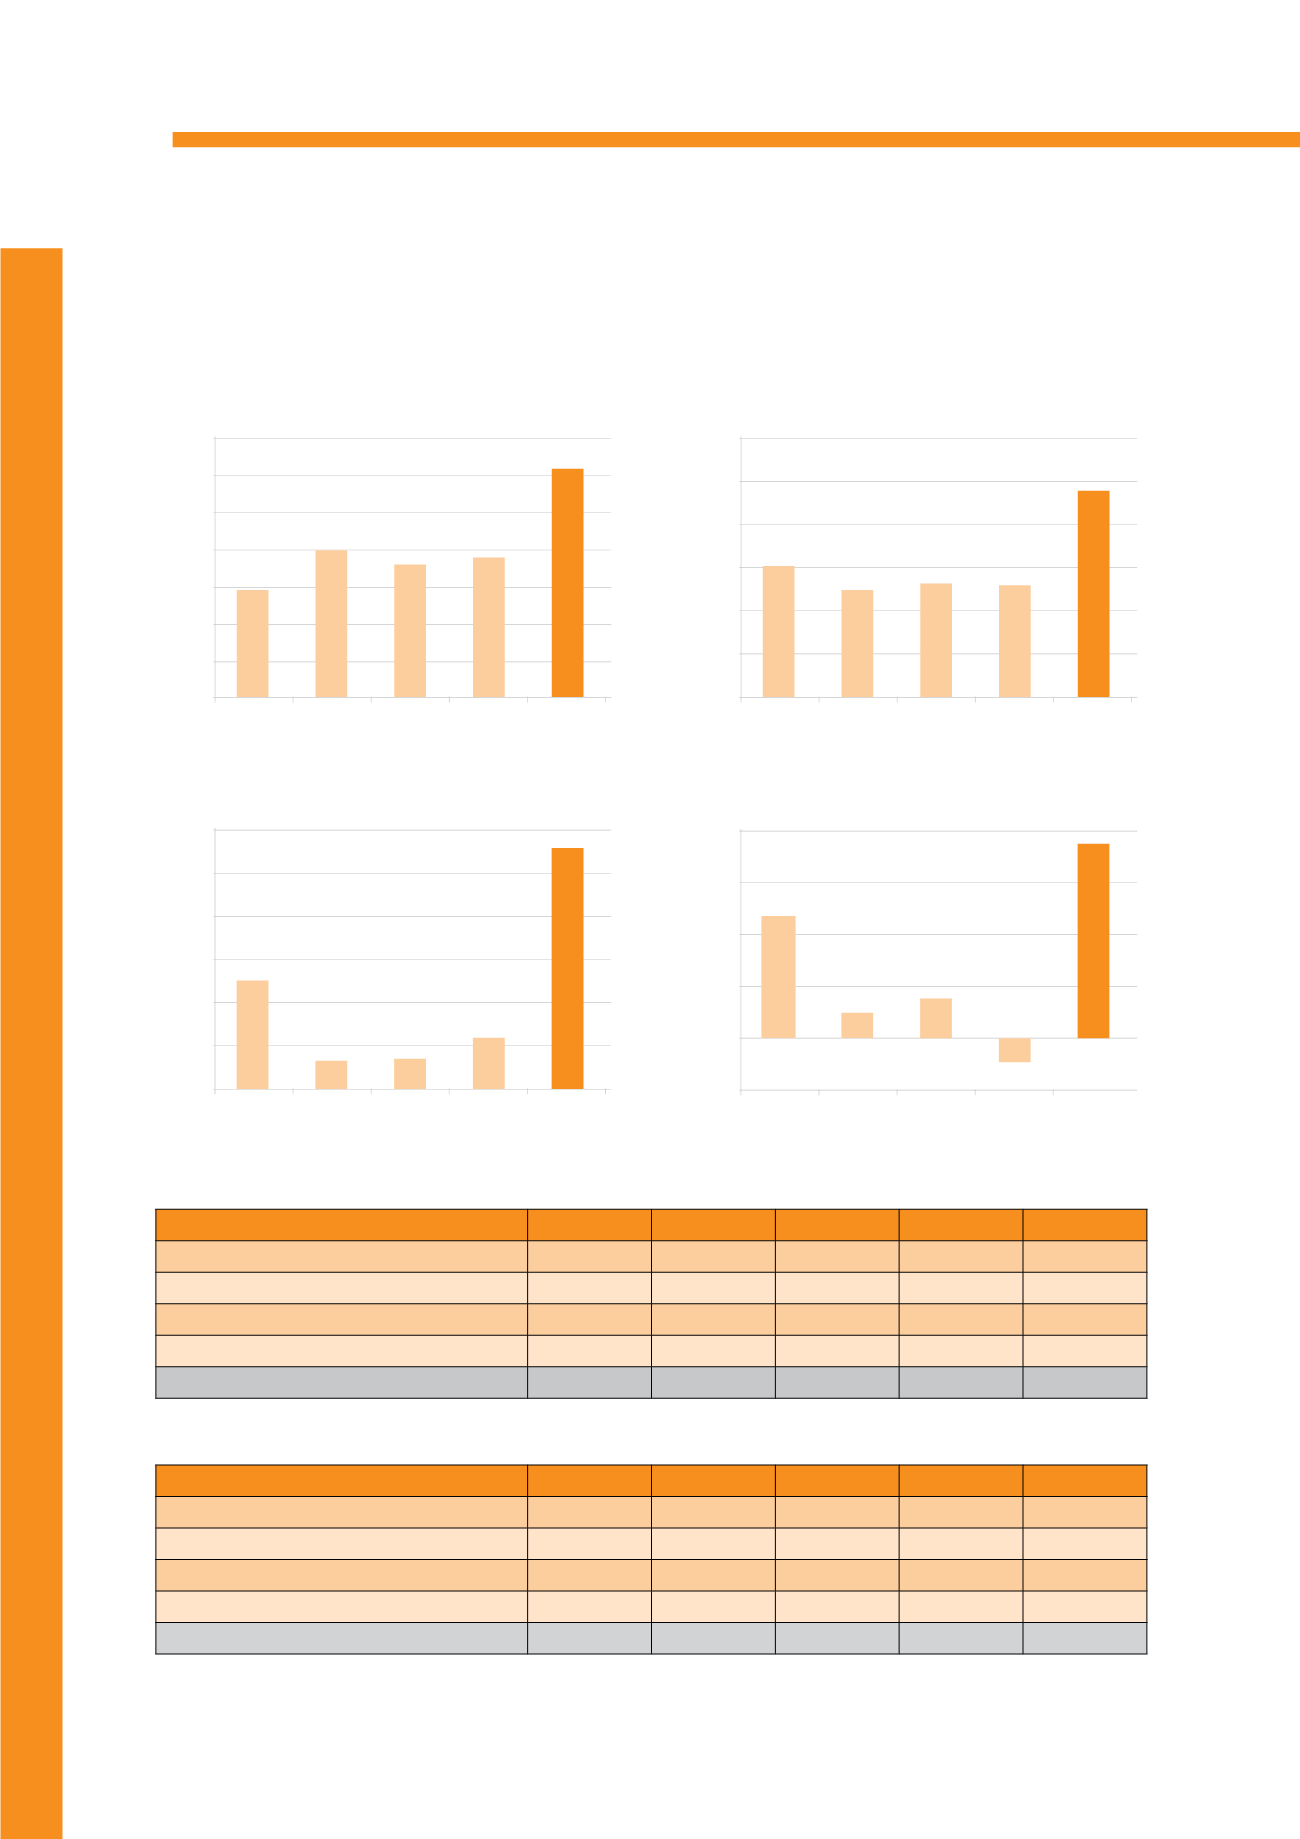
REVENUE (RM’000)
EARNING BEFORE INTEREST, TAX, DEPRECIATION AND AMORTISATION (RM’000)
2011
2012
2013
2014
146,704
198,123
2010
0
10,000
20,000
40,000
30,000
50,000
60,000
2011
2012
2013
2014
181,035
190,611
309,845
30,342
24,819
26,276
26,106
47,790
PROFIT BEFORE TAX (RM’000)
2010
0
5,000
10,000
20,000
15,000
25,000
30,000
2011
2012
2013
2014
NET PROFIT (RM’000)
2010
(5,000)
0
5,000
15,000
10,000
20,000
2011
2012
2013
2014
(2,321)
3,820
2,484
11,989
28,140
5,911
3,238
2,999
13,103
18,775


